About flat teams

In a company where decisions are made by one person, the question of analytical culture simply won't arise. In such companies, the manager has his own vision and independently distributes tasks among subordinates. They, in turn, delegate tasks to their employees — and so on. This is how companies with hierarchies of positions that are familiar to us live.
The weak point of this way of life is the transfer of responsibility. The task setter is responsible for the result. In order not to fail those above, he describes in as much detail as possible what a subordinate needs to do, and creates a system of penalties and KPIs as a safety net.
The subordinate, being closest to the customer, production and/or reality, realizes that it is irrational to solve the problem in this way. “But if the boss said 'must', then it is necessary.” And if the result is bad, it's the boss's own fault. After all, he set the task.
There is another unpleasant aspect to the hierarchical management model — this time it is personal. As a person striving for development, I want to be surrounded by strong people and be on equal terms. But when the task setter is responsible, he has to give instructions and tell him what to do in order to achieve the desired result. The performer is deprived of the opportunity to express his opinion, his idea. Of course, in this case, equal communication is out of the question.
Flat teams appear where the performer does not perform the task strictly according to the terms of reference. He sees the problem, thinks through what needs to be done and in what way. Everyone only agrees on success metrics.
I often hear leaders express one concern about moving to flat teams: “there will be many points of view, everyone will pull the blanket over themselves.” Or one more thing (but in fact it's the same thing): “the distribution of responsibility among employees will be very unclear; they will simply start dumping it on each other.”
Such concerns are not unfounded, but the transition to flat teams looks very tempting, as a company that adheres to this concept can live and develop without a leader. And it's not just about ethical beauty. Quitting the operating system, ceasing to be tied to work processes, and finally finding time for dreams and strategic planning is probably the wish of any leader.
Communication lies at the root of the problems that can arise when moving to flat teams.
If you can no longer command and “hide behind” your high position, how can you argue your own point of view?
If age, experience, and experience are no longer key factors in deciding who to listen to, how can the team know whose opinion is really interesting, useful, and valuable?
And if you still imagine that you can “exit” the operating system and not have control over what tasks the team is doing, then how can we stick to the right development vector and avoid chaos?
To take communication from the plane of opinions to the level of reasoned dialogue, and to translate personal conflicts into conflicts of interest, you need to learn to rely on facts. A fact is something that everyone agrees with, something that does not depend on the point of view.
For example, the number of sales or unique sessions on the site. In short, metrics. And this is where an understanding of analytical culture is born.
In my opinion, analytical culture is a culture of managerial decision-making in which it is possible to rely only on facts and metrics.
The company's transition to an analytical culture
In theory, as is often the case, it sounds easy and simple. But practice has shown otherwise.
We used to have kt.team the marketing department had the following structure: one manager (who developed strategies and set goals) and his team — content manager, layout designer, copywriters, and analyst. I wanted the whole team, not just the manager, to be able to make management decisions.
The analyst prepared a dashboard, which the team eventually used, not to say very actively.
This is how we learned our first lesson: you don't need to make dashboards if they are not requested.
We should start by changing the management culture. As a stakeholder, I tell you what problems the company has and what my wishes are. The team then formulates a hypothesis about what actions can be taken to solve these problems. To determine whether a hypothesis has worked or not, criteria are chosen — what should change? If this is a delta, you need to understand how to measure the situation before and after the planned actions are taken.
Only when a team looks for solutions and creates a backlog themselves can they find metrics that they will use.
After that, you don't need to make a dashboard right away. Open the good old Excel and write the data manually. Why?
It's like the difference between cash and money on a card. When you pay by bank transfer, there is no physical feeling of reducing the amount of funds left. The wallet, on the other hand, is empty quite “visually”.
The same is true here: to understand and feel whether the right metrics have been chosen as key metrics, you need to take indicators manually. After three days of rewriting the number of views on each post, it's obvious that this metric isn't needed. The difference between the number of views of past and new posts does not allow us to draw definite conclusions. In the case of a social network, it's enough to monitor only trends and engagement to see if the right strategy was chosen for creating content.
In addition to the difficulty of finding the very metrics that can be used to make decisions, it is difficult to determine metrics that reflect reality.
Here's an example of a metric that distorts reality.
In the online store, nine users purchased one item per order, and a tenth purchased 100 items. The average number of items per customer will be approximately 11.
It seems that everything is fine. A convenient metric. Next, we calculate an acceptable price per lead, assuming that, on average, one customer purchases 11 items.
We launch ads. And if you don't understand in time that this metric distorts reality — in fact, the average person buys one product — you can go into the red. A big disadvantage.
To the problem of choosing metrics, another, no less significant one, is added: how to understand How many metrics are enough to reflect reality as clearly and completely as possible?
End-to-end analytics and BI systems
Let's imagine that the stage of “impregnation” with analytical culture has been completed; each department or counterparty has found its own metrics. Everyone is working, taking the initiative and achieving their goals.
But there is no result. Or there is one, but the wrong one.
While departments in a company may not know what is going on with their colleagues in other departments, the client, on the contrary, goes from a need to recommending the company to neighbors, comes into contact — directly or indirectly — with the work of each department, counterparty and/or contractor.
The points where one's responsibility ends and the other's responsibility begins are sometimes overlooked.
Accounting monitors their metrics in 1C, salespeople — in CRM, marketers — in Google Analytics.
Everything can be fine in each of these systems. But to see the whole picture, we need an integrator that allows for end-to-end analytics. BI systems can be used to solve this issue.
BI systems are systems that aggregate information from different sources. We use Power BI because it does not require special analytical knowledge to work with dashboards, which means that all employees can use such software — data understanding is available to everyone. In addition, for ease of use, information can also be visualized.
And it was with the help of BI that one of our clients managed to set up a convenient tracking of points where one counterparty ends the work and another connects.
In this project, we are integrating an order collection system and delivery services.
The dashboard shows how many orders were in total, how many were taken to the warehouse, how many were delivered to the end customer and how many were canceled (Figure 1).
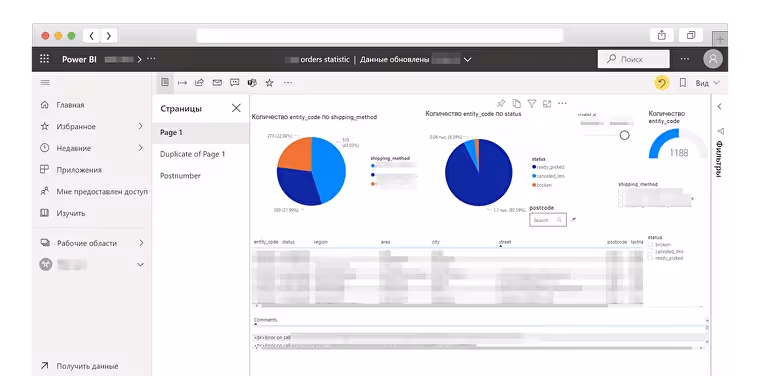
If you need to read more detailed data, choose canceled_lms. A list of errors that have occurred will be displayed under the dashboard (Figure 2).
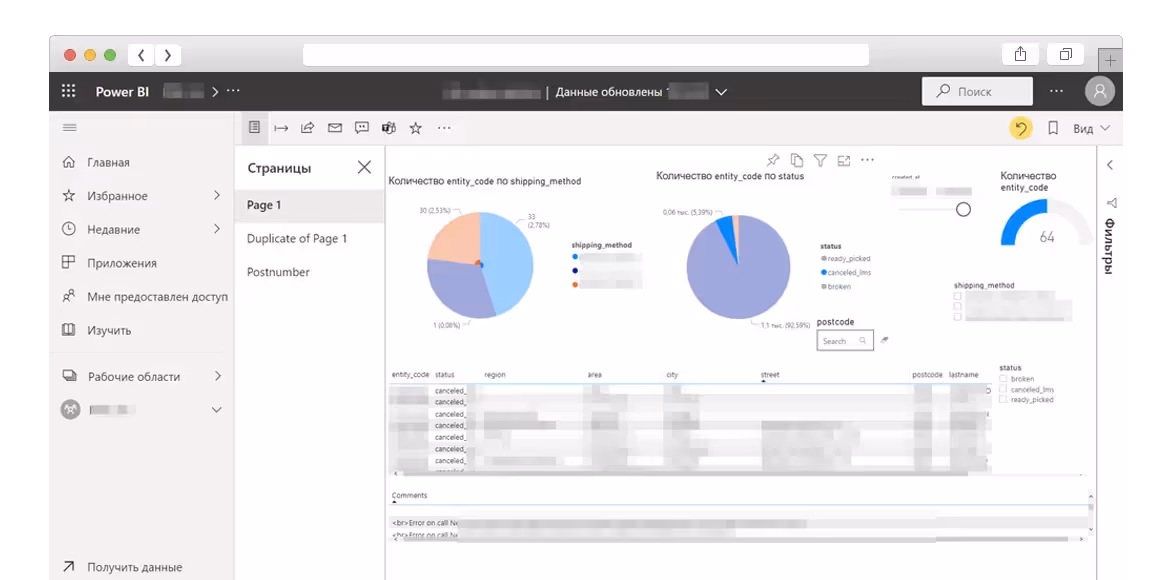
In this case, an idea of how the “order — order collection — delivery” link works, what errors occur and when, helps you decide whether something else needs to be improved in the integration or whether you can already proceed with the launch. At first, half of orders were canceled at the delivery stage, now it is about 7%.
The problem was that the addresses that the online store gave to delivery could not be used to create orders. Somewhere they did not specify the region, and there were about a dozen cities with that name across the country, in others they incorrectly spelled out the street name, etc. It was important to understand at what stage orders were lost, and then agree with the online store to optimize the processes of capturing, storing and processing customer addresses.
But the most important thing is that now all stakeholders see the same data and can agree on metrics, ways to solve problems and further develop the project.
Using BI, we were able to set up not only tracking errors, but also obtaining detailed information about the reasons for their occurrence, which ultimately made it possible to make a number of important decisions about the further development of the project.
Conclusion
The company's transition to an analytical culture is a lengthy process that requires, first of all, a review of management methods. But if earlier it was simply impossible to broadcast information about the current state of affairs to everyone interested (at this point in time, and not based on the results of a year or any other reporting period), now BI systems make such communication simple and convenient.